
Accelerate Your Loan Payoff–Free Amortization Chart Calculator with Target Duration & Strategy Tools
Plan your path to early debt freedom with our advanced Amortization Chart Calculator. Set your Target Payoff Duration and visualize savings through dynamic charts — 100% free, private, and runs entirely in your browser.
Tooltips for Amortization Chart Calculator
Target Payoff Duration
Enter your desired payoff term. The calculator will determine the required payment to meet this goal.
Note :
When a Target Payoff Duration is entered, the calculator overrides any Extra Monthly Payment or Lump Sum values. To see their effect individually, clear this field.
Extra Monthly Payment
Enter any extra amount you plan to pay each month in addition to your regular monthly payment.
Start Month Tooltip:
This extra amount will be added to your standard P&I every month starting from the month you select.
Lump Sum Payment
Use this to plan one-time principal reductions (e.g., from a bonus or inheritance). You can add multiple lump sums. Each is applied on the next payment date after the specified date.
Show Cumulative Interest (Toggle)
When ON, charts show cumulative interest paid over time. When OFF, charts show individual period interest — ideal for comparing strategies.
Chart Type Selector
Choose how to display your charts — Line charts for trends, or Bar charts for comparisons.
Chart Resolution
Choose Monthly for detailed insight or Yearly for a high-level overview — useful for long-term loans.
Amortization Chart Calculator – Your Visual Path to Loan Freedom
If you’ve ever felt a knot in your stomach looking at your loan statements, wondering exactly where all your money is going, or if you could ever pay it off sooner, you’re not alone. Loans—whether for a home, a car, or your education—can feel like a complex maze of numbers, interest rates, and long terms. It’s easy to get lost in the monthly grind, simply making payments without truly understanding their long-term impact. You might even feel a little overwhelmed, like you’re just a small boat adrift on a vast ocean of debt. We get it.
That feeling of confusion, or even resignation, is precisely why we created the Amortization Chart Calculator. Imagine being able to see, with crystal clarity, how every dollar you pay chips away at your principal and how even strategically planned contributions can slash years off your loan and save you a fortune in interest. This isn’t just another calculator spitting out numbers; it’s a powerful visualization tool, designed to transform those intimidating spreadsheets into intuitive charts and clear comparisons. It helps you navigate the complexities of your loan, shining a light on opportunities to take control, accelerate your payoff, and ultimately, find your way to financial peace of mind. It’s about empowering you to make smarter, more confident decisions, turning that sense of dread into a feeling of genuine control.
What Is an Amortization Chart Calculator?
Let’s demystify it together. At its heart, an amortization chart calculator is a sophisticated online tool that takes the core details of your loan – things like how much you borrowed, your interest rate, and how long you have to pay it back – and then breaks down every single payment you’ll make. But it doesn’t stop there. While a traditional amortization schedule is typically a long, detailed table (think rows and rows of numbers showing principal paid, interest paid, and remaining balance for each payment), our Amortization Chart Calculator goes a crucial step further. It takes that numerical data and transforms it into dynamic, easy-to-understand charts. Think of it as painting a picture of your loan’s journey. You’ll see lines curving downwards as your balance shrinks, or bars illustrating how the split between principal and interest changes over time. This visual approach is incredibly powerful because it allows your brain to process complex financial information much more quickly and intuitively than simply staring at columns of figures. You can instantly grasp trends, identify inflection points, and, most importantly, visualize the impact of different payoff strategies. It’s about making your financial future feel less like a guessing game and more like a clear, actionable plan. It gives you the power to see your progress and your potential.
Why Visualization Matters in Loan Planning
You might wonder, “Why do I need a chart when I can just look at the numbers?” That’s a fair question, and the answer lies in how our brains are wired. We’re inherently visual creatures. When faced with a dense table of figures, our eyes glaze over. But show us a graph, and patterns, trends, and opportunities jump out. Here’s why visualization, as offered by our Amortization Chart Calculator, is a game-changer for your loan planning:
- Clarity in Complexity: Loan amortization is inherently complex. Early payments are mostly interest, later payments mostly principal. Without a visual aid, this can be hard to grasp. Charts make this fundamental concept immediately clear, demystifying the process and showing you exactly where your money is going with each installment.
- Instant Impact Assessment: Imagine you’re considering a strategic payment. Typing an amount into a traditional calculator might give you a new total interest figure, but our Amortization Chart Calculator will redraw the balance curve, showing you precisely how much faster your loan disappears and how drastically your interest line flattens out. This instant visual feedback is incredibly motivating.
- Spotting Trends and Milestones: Charts allow you to quickly identify key moments: when you cross the 50% principal paid mark, when your interest payments start falling dramatically, or when your loan will finally be paid off. These milestones become visible goals, making the long journey feel more manageable and achievable.
- Empowering “What If” Scenarios: Want to see what happens if you apply an annual lump sum or commit to a target payoff? The visual comparison lets you intuitively weigh different strategies against each other, helping you pick the one that aligns best with your budget and goals. It turns abstract numbers into concrete, comparative outcomes.
- Payoff Tracking and Motivation: Seeing your loan balance visually decline and knowing your exact payoff date can be a powerful source of motivation. It transforms your debt from a looming cloud into a conquerable mountain, where every payment contributes to visible progress on your chart. It reinforces that you are moving forward.
In essence, while numbers tell a story, charts make it come alive. Our Amortization Chart Calculator helps you not just understand your loan, but truly feel in control of its future.
How to Use the Amortization Chart Calculator: Your First Step to Clarity
How to Use the Amortization Chart Calculator: Your First Step to Clarity
The Amortization Chart Calculator is designed to be intuitive, allowing you to quickly unlock insights into your loan. We’ve built it with simplicity in mind, so you can focus on planning, not figuring out complex interfaces. Here’s a gentle walkthrough of how to use it, starting with a simple scenario to get you familiar:
Getting Started: Loan Details (Your Beginner Template)
Let’s start by entering the basic details of a typical loan. You’ll notice the calculator might already have some default values, making it even easier to begin.
- Currency: Look for the “Currency” dropdown. This is important for ensuring all financial figures (like your payments and total interest) are displayed in the correct format for your region. We support USD (),EUR(€),GBP(£),CAD(), and AUD ($), making it globally relevant.
- Loan Amount: This is the initial principal amount you borrowed. For a beginner example, you might start with the default $300,000. Just type in the numerical value.
- Interest Rate (%): Enter the annual interest rate of your loan as a percentage. For example, for 3.5%, just type “3.5”.
- Loan Term (years): How many years is your loan scheduled for? Input that number here. For instance, a typical mortgage might be “30” years.
- Loan Start Date: Select the date your loan payments began or are set to begin. This helps the calculator accurately project future payments and payoff dates. Our friendly date picker makes this quick and easy. The calculator will often default to the first day of the current month.
Once you’ve entered these initial details, you can immediately click the “Calculate” button to see your baseline amortization schedule and charts. This gives you a starting point.
Crafting Your Payoff Strategy
This is where you can begin to customize and explore ways to potentially pay off your loan faster and save money. You’ll see these options organized within expandable sections, which you can click to open or close.
- Target Payoff Duration (Years): This is a powerful and unique feature of the amortization chart calculator. Here, you can input your desired payoff term in years (e.g., “15” years instead of your original “30” years). A tooltip on the field clarifies: “Enter your desired payoff term. The calculator will determine the required payment to meet this goal.” Important Note on Overrides: When a Target Payoff Duration is entered, the calculator intelligently focuses on achieving that specific duration. This means that any values you enter for “Extra Monthly Payment” or “Lump Sum Payments” will be ignored. To see the effect of extra payments or lump sums on their own, simply clear the “Target Payoff Duration” field.
- Extra Monthly Payment: Have some extra cash you can commit to your loan each month? Type that amount here. Even a small, consistent figure can have a surprising impact.
- Start Month: A tooltip for this field clarifies: “This extra amount will be added to your standard P&I every month starting from the month you select.”
- Lump Sum Payments (Optional): Got a bonus, a tax refund, or an inheritance coming your way? Our Amortization Chart Calculator allows you to factor in these one-time principal reductions.
- Add Lump Sum Button: Click this button to add a new row.
- Amount & Payment Date: For each lump sum, enter the specific amount you plan to pay and the date you anticipate making that payment. You can add as many lump sums as you need, giving you incredible flexibility in your planning. The calculator’s logic ensures: “Lump sums are applied on the next payment date after the specified date.”
Customizing Your Charts (Optional)
The calculator’s visual elements are highly customizable, giving you control over how you view your loan data.
- Show Cumulative Interest Toggle: Switch this on if you want your interest chart to display the total accumulated interest over time. If it’s off, the chart will show a comparison of the total interest paid for each strategy.
- Chart Type: Choose between a “Line” graph (great for showing continuous trends) or a “Bar” graph (excellent for comparing discrete data points, like yearly balances or total interest by strategy).
- Chart Resolution: Decide if you want your charts to display data “Monthly” (more granular detail, ideal for short-term loans or early mortgage years) or “Yearly” (a broader, long-term view, excellent for mortgages).
The Grand Finale: Calculate!
Once you’ve entered all your details and desired strategies, it’s time for the magic to happen!
- Calculate Button: Click this. You’ll see a small loading spinner, and then your detailed results will instantly appear in the “Results Section”.
- Reset Button: Made a mistake or want to start fresh? The “Reset” button will clear all fields, allowing you to begin a new scenario.
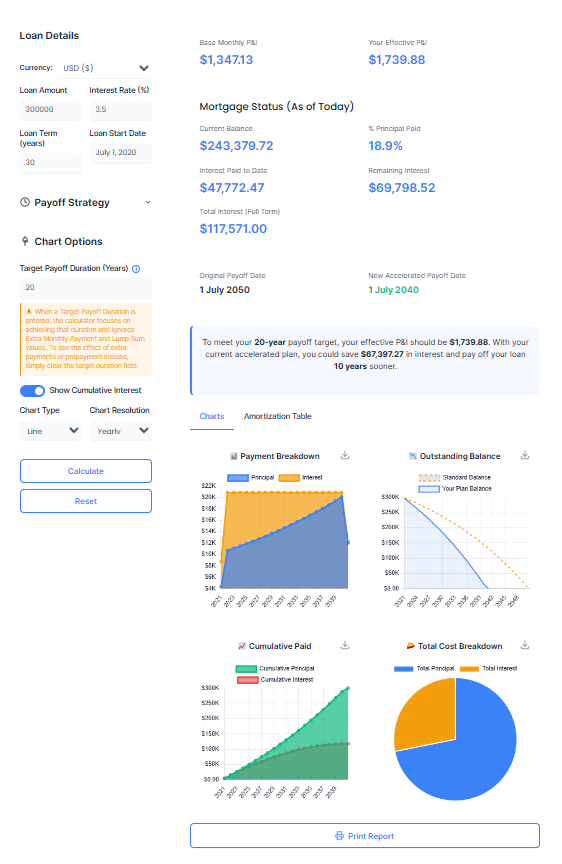
This example illustrates a typical 30-year loan scenario: $300,000 at 3.5% interest, with a Target Payoff set to 20 years — perfect for those aiming to achieve their loan payoff goal earlier. The result? Over $67,000 in interest saved and more than 10 years cut from the repayment timeline — all clearly visualized in the balance and interest charts below.
Curious how your loan really works behind the scenes?
Our Amortization Chart Calculator lays out every payment, interest charge, and balance drop — so you stay in full control.
Understanding Your Results: Beyond the Numbers
Once you click “Calculate,” the Amortization Chart Calculator transforms your inputs into actionable insights, presented in clear summary cards before the detailed charts and tables.
- Payoff Report Card: This card provides an immediate snapshot of your loan’s financial trajectory.
- Base Monthly P&I: Shows what your original, minimum required Principal & Interest payment would be.
- Your Effective P&I: Displays the new monthly payment amount required by your chosen strategy (whether it’s an extra payment or the amount calculated for your target payoff duration).
- Mortgage Status (As of Today): This dynamic section is especially powerful for ongoing loans. If your loan’s start date is in the past, it provides real-time estimates for:
- Current Balance: Your estimated outstanding loan amount today.
- % Principal Paid: The percentage of your original loan amount that you’ve already paid off.
- Interest Paid to Date: The total interest you’ve accrued so far.
- Remaining Interest: The estimated interest still to be paid over the remainder of your loan.
- Total Interest (Full Term): The total interest you will pay under your accelerated plan.
- Original Payoff Date: Your loan’s planned end date if you only make minimum payments.
- New Accelerated Payoff Date: The exact date you are projected to pay off your loan under your strategic plan. This date will be highlighted in green if you’re accelerating your payoff.
- Summary Card: This provides a concise textual summary of your projected savings and accelerated payoff time. For instance, it might tell you how much interest you could save and how many years or months sooner you’ll be debt-free compared to your original plan. If you’ve used the “Target Payoff Duration,” it will clearly state the effective payment needed to meet that goal.
These summary sections give you a quick, powerful overview before you dive into the detailed visualizations.
Deep Dive into Your Visuals: Charts and Amortization Table
The true strength of the Amortization Chart Calculator lies in its ability to visualize your loan’s progress. After the summary cards, you’ll find two main tabs: “Charts” and “Amortization Table.” These tabs allow you to explore your loan data in different yet equally insightful ways.
Chart Interpretation: What the Graphs Tell You
The “Charts” tab presents several dynamic graphs that offer immediate clarity. Remember you can customize these charts with “Line” or “Bar” types and “Monthly” or “Yearly” resolution for different perspectives. You can also download each chart as an image for your records.
- Payment Breakdown Chart: This chart vividly illustrates how each of your monthly payments is allocated between principal and interest. You’ll observe a clear trend: in the initial years, a larger portion of your payment typically goes towards interest. As your loan matures and the principal balance decreases, the proportion shifts, with more and more of your payment attacking the principal. This visual breakdown helps you demystify why early prepayments are so effective in saving on interest—they immediately reduce the portion of your payment going to the cost of borrowing.
- Outstanding Balance Chart: This is arguably the most impactful chart for visualizing your journey to debt freedom. It plots your loan balance decreasing over time.
- You’ll see a “Standard Balance” line (often dashed) representing your loan’s natural decline if you only make minimum payments.
- Crucially, you’ll also see a “Your Plan Balance” line. When you use the “Target Payoff Duration” or factor in extra payments, this line will show a significantly steeper decline, reaching zero much faster than the standard path. This visual difference powerfully demonstrates the years you’re shaving off your loan term.
- If you set a “Target Payoff Duration,” a dashed red line will also appear at your desired end point, allowing you to instantly see if your strategy is on track to meet your specific goal. This chart provides a powerful visual comparison, clearly showing the years you are shaving off your loan term.
- Cumulative Paid Chart: This chart tracks the running totals of how much principal and interest you’ve paid over the life of the loan. It’s a great way to see your long-term progress and the total financial outlay.
- When the “Show Cumulative Interest” toggle is on, you’ll see two lines (or bars): cumulative principal paid and cumulative interest paid. The widening gap between “Your Plan Cumulative Interest” and the “Standard Cumulative Interest” powerfully demonstrates the thousands of dollars you’re saving by accelerating your payments.
- When the toggle is off, it often best highlights the sheer volume of principal you’ve returned to the lender over time.
- Total Cost Pie Chart: This simple yet effective chart provides an immediate visual summary of the total cost of your loan. It breaks down the overall amount you will pay into two slices: one representing the Total Principal you paid back (the actual amount you borrowed), and the other showing the Total Interest you paid over the entire life of the loan. For long-term loans, you might be surprised to see just how large the “Total Interest” slice is. It often equals, or even exceeds, the principal amount borrowed! This visual is a stark reminder of the hidden cost of prolonged debt and serves as a powerful motivator to pay off your loan faster. Our Amortization Chart Calculator makes this financial reality impossible to ignore, encouraging you to reduce that “interest” slice as much as possible.
This chart illustrates the year-wise breakdown of mortgage payments for a $300,000 loan at 3.5% interest over a 30-year term. The blue area represents the principal portion of payments, which gradually increases each year. The orange area shows the interest portion, which steadily decreases. Throughout the loan term, the total monthly payment remains relatively consistent, while the share of principal grows and interest shrinks—clearly visualizing how amortization shifts payment distribution over time.
By examining these charts, you gain a comprehensive understanding of your loan’s dynamics, empowering you to make informed decisions about your financial strategy.
Making Sense of the Amortization Table
For those who prefer granular detail, the “Amortization Table” tab provides a meticulous, payment-by-payment record of your chosen accelerated strategy. Think of it as the ultimate roadmap for your loan, detailing every step of the journey. You can toggle between “Yearly” and “Monthly” views for different levels of detail.
The table typically includes the following columns:
- # / Year: This sequentially numbers each payment you make (for monthly view) or the year of the loan (for yearly view).
- Date: This column lists the exact date each payment is due. This is invaluable for budgeting and knowing precisely when your loan will be retired.
- Payment: This is the total amount you will pay on that specific date, including both your principal and interest components, and any extra monthly payments.
- Principal: This crucial column shows the portion of your Payment that goes directly towards reducing your outstanding loan balance. You’ll observe that early in the loan, this amount is smaller, but it steadily grows over time.
- Interest: This column displays the portion of your Payment that covers the interest accrued since your last payment. You’ll notice this amount is higher initially and gradually decreases as your principal balance shrinks.
- Lump Sum: If you’ve scheduled any lump sum payments, this column will clearly indicate the amount applied on the payment date following your specified lump sum date. These entries powerfully demonstrate how a one-time injection can dramatically reduce your balance.
- Balance: This is your remaining outstanding loan balance after that particular payment (and any applied lump sums) has been processed. You’ll see this number steadily decline towards zero.
The Amortization Table transforms your complex loan into a clear, manageable sequence of steps, empowering you with precise information to stay on track.
Target Payoff Duration: Your Ultimate Loan Shortcut
The “Target Payoff Duration” feature is one of the most powerful capabilities of the Amortization Chart Calculator, designed for individuals with a clear finish line in mind. Instead of simply seeing how much you might save with extra payments, this feature allows you to declare exactly when you want to be debt-free.
When you input your desired payoff term (e.g., “15 years” instead of your original “30 years”), the amortization chart calculator performs an immediate recalculation. It determines the precise monthly payment amount (Principal and Interest) you’ll need to make consistently to hit that exact target date. This means the calculator is doing the complex math for you, translating your long-term goal into an actionable monthly commitment. As noted earlier, this feature completely overrides any separate “Extra Monthly Payment” or “Lump Sum Payment” entries you might make, ensuring that the calculator focuses solely on helping you achieve your declared target payoff. It’s the ultimate tool for proactive loan management, giving you a clear financial roadmap to reach your desired debt-free date.
Example Scenario
Let’s illustrate the power of this feature. Imagine you have a loan of $300,000 with an interest rate of 5% over a standard 30-year term. Your calculated base monthly Principal & Interest (P&I) payment for this loan would be approximately $1,610.
Now, suppose you use the Amortization Chart Calculator and, instead of adding extra payments, you define a clear goal: you want to pay off this loan in just 15 years. You input “15” into the “Target Payoff Duration” field. The calculator instantly re-evaluates. It shows that to achieve this accelerated 15-year payoff, your new effective monthly P&I payment would need to be around $2,372. This clear, upfront calculation helps you understand the commitment required to meet your ambitious financial goals.
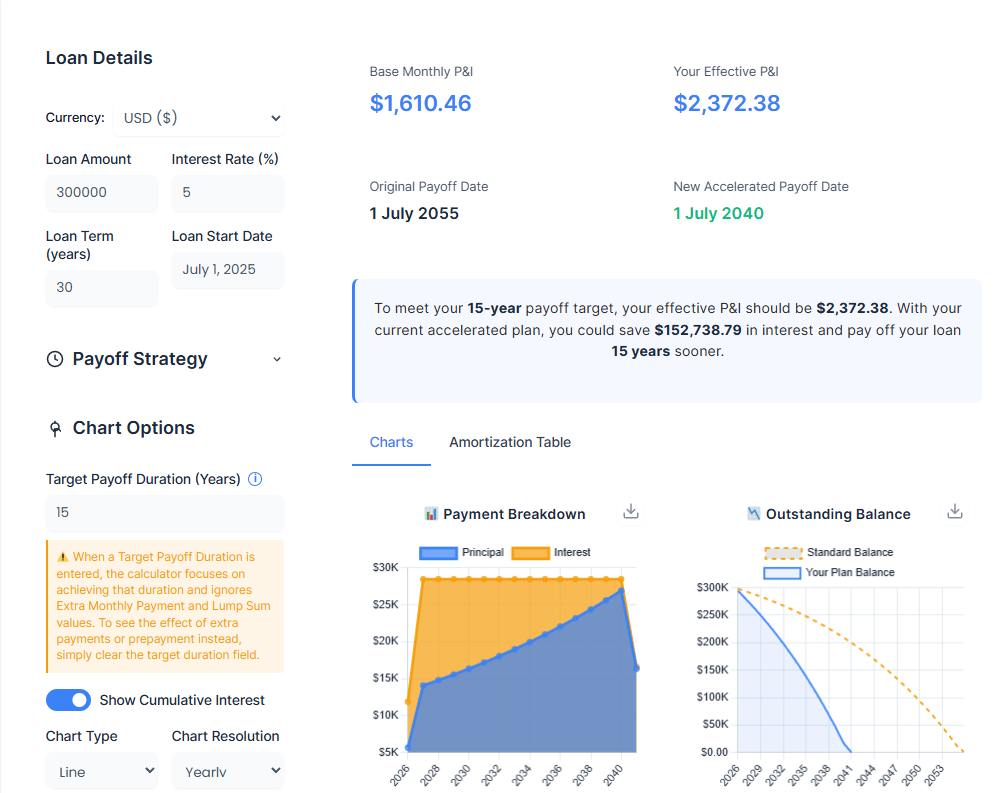
This direct feedback allows you to immediately see the financial adjustments necessary to reach your desired payoff date, making your financial planning tangible and actionable. It highlights the direct link between a defined goal and the required financial discipline.
Impact of Other Strategic Payments: Extra Monthly and Lump Sums
While the “Target Payoff Duration” is paramount for setting a firm end date, the amortization chart calculator also allows you to explore the impact of other effective prepayment strategies when a fixed target isn’t your primary method or when the target duration field is left blank.
- Extra Monthly Payment: Even small, consistent additions to your monthly payment can have a surprisingly large impact over time. By adding a fixed amount, say $50 or $100, to your regular payment each month, you directly chip away at your principal balance faster. This reduces the amount of interest that accrues on the loan, leading to a shorter loan term and significant savings on total interest paid. It’s a gradual but powerful way to accelerate your payoff without needing a large one-time sum.
- Lump Sum Payments: These are one-time, substantial payments made directly towards your loan principal. They can come from various sources, such as a tax refund, an annual bonus, an inheritance, or unexpected windfalls. A lump sum payment immediately reduces your outstanding principal, meaning less interest will be calculated on your remaining balance from that point forward. This can shave years off your loan term and result in considerable interest savings.
For a deeper dive into how different prepayment strategies compare and to fine-tune your approach, you can refer to our dedicated tool: Pay Off Mortgage Faster Calculator.
Scenario Walkthrough: Smart Loan Planning in Action
Let’s walk through a couple of practical scenarios to see how the Amortization Chart Calculator brings your loan journey to life.
Scenario 1: Using Target Payoff Duration for a 20-Year Goal
Consider a loan of $400,000 at an interest rate of 4.5% over a 30-year term. Without any intervention, your base monthly payment would be approximately $2,027, and you’d pay off the loan in 30 years.
Now, imagine you use the Amortization Chart Calculator and explicitly set a “Target Payoff Duration” of 20 years. The calculator immediately tells you that to achieve this goal, your new required monthly payment would be approximately $2,530. By committing to this higher payment, the calculator shows you’d not only cut 10 years off your loan term but also save a substantial $1,22,283 in total interest over the life of the loan. This is a clear, actionable plan to save a significant sum and become debt-free faster, directly driven by your chosen target.
Scenario 2: The Power of a Consistent Extra Monthly Payment (No Target Set)
Let’s revert to our original 30-year loan of $400,000 at 4.5% interest, with a base payment of $2,027. This time, you leave the “Target Payoff Duration” field blank, and instead, decide to simply add an “Extra Monthly Payment” of $250.
After recalculating with the amortization chart calculator, this seemingly small addition accelerates your payoff by approximately 6 years. Furthermore, this strategy results in an impressive interest saving of nearly $75,000 over the life of the loan. This scenario highlights how even modest, consistent additional payments can dramatically alter your loan’s trajectory and overall cost, without requiring a drastic change to your lifestyle, especially when you don’t have a precise target payoff date in mind.
These walkthroughs demonstrate how the amortization chart calculator empowers you to explore different strategies and see their tangible financial outcomes.
Top Use Cases Globally
The beauty of the Amortization Chart Calculator lies in its universal applicability. While loan types and terms may vary by country and lender, the underlying principles of amortization remain the same. This tool is incredibly versatile and can be adapted for a wide range of financial planning scenarios across the globe. Here are some of the top use cases where our amortization chart calculator can provide immense clarity and strategic advantage:
- Mortgage Planning (Home Loans): This is arguably the most common and impactful use. Mortgages are often the largest debt most individuals take on, spanning decades. Use the Amortization Chart Calculator to understand how many years and how much interest you can save by making modest extra payments, compare the long-term cost differences between different loan terms, see the dramatic effect of an annual lump sum payment (like a bonus) on your payoff date, and strategize how to pay off your mortgage before retirement, or before your children start college.
- Student Loan Management: Student debt can be a heavy burden. This calculator helps you visualize how consistent small extra payments can reduce your loan term by years, plan for lump sums from tax refunds or graduation gifts to significantly reduce your principal, and gain a clear roadmap to financial freedom from student debt much sooner.
- Personal Loan & Auto Loan Strategies: Even shorter-term loans benefit from strategic planning. Use the amortization chart calculator to see how quickly you can clear a personal loan by adding a little extra each month, or determine the true interest cost of your car loan and how to minimize it.
- Budgeting & Financial Goal Setting: Beyond specific loan types, the calculator is a powerful budgeting aid. It helps you quantify the tangible benefits of saving money and directing it towards debt, set realistic debt payoff goals and track your progress visually, and feel more in control of your financial destiny by seeing a clear path forward.
No matter where you are in the world, or what type of amortizing loan you have, our Amortization Chart Calculator offers a clear, visual, and actionable path to understanding and mastering your debt. It’s a universal tool for financial empowerment.
Advanced Features That Set This Tool Apart
While the core functionality of the Amortization Chart Calculator is already robust, we’ve thoughtfully included a few advanced features designed to give you even greater control and insight into your loan planning. These elements move beyond basic calculations, offering sophisticated ways to fine-tune your strategy and manage your results.
- Multi-Currency Selector: Recognizing its global utility, the calculator includes a currency selector. You can choose from common currencies like USD ($),EUR(€),GBP(£),CAD($), and AUD ($), ensuring that your calculations are relevant to your local financial context.
- Date Pickers for Precise Strategy Setup: Our calculator features intuitive date pickers for your loan start date, extra payment start date, and lump sum payment dates. This precision allows you to model your financial strategies exactly as you plan them, accounting for real-world timing.
- Smart Logic: Target Payoff Overrides Other Payoff Strategies: A key intelligent feature is how “Target Payoff Duration” interacts with other payment options. When you set a target duration, the amortization chart calculator intelligently prioritizes that goal. This means any entered “Extra Monthly Payment” or “Lump Sum” amounts will be disregarded, as the calculator’s primary focus becomes determining the exact payment needed to meet your desired payoff term. This prevents conflicting inputs and ensures clarity in your strategy.
- Export and Print Options: Your Plan, On Your Terms: Your financial plan is important, and we believe you should be able to access and share it in a format that works for you.
- Downloadable Charts: Each interactive chart has a “Download Chart” button. With a single click, you can save a high-quality PNG image of that specific chart to your device. This is perfect for digital records, presentations, or sharing with family or advisors.
- Printable PDF-Friendly Report: At the bottom of the results section, you’ll find a “Print Report” button. Clicking this prepares a comprehensive, beautifully formatted report of your entire analysis, optimized for printing or saving as a PDF. This report includes your loan details, chosen strategies, the executive summary of your payoff, the detailed strategy comparison table, and high-resolution images of all the charts you generated. The benefit: This functionality allows you to keep a permanent record of your financial planning.
These advanced features enhance the Amortization Chart Calculator from a simple calculator to a holistic financial planning and documentation tool, giving you complete control over your loan strategy.
Want to explore ways to pay off your loan sooner? Use our Payoff Mortgage Faster Calculator to model different strategies.
Frequently Asked Questions (FAQs) About Amortization Chart Calculator
We know that navigating loan details can bring up many questions. We’ve compiled some common queries about our Amortization Chart Calculator to help you gain clarity and confidently plan your loan payoff.
What exactly is loan amortization, and why should I care about it?
Amortization is the process of gradually paying off a debt over a set period through regular, scheduled payments. Each payment you make is meticulously split between covering the interest (the cost of borrowing money) and reducing your principal (the actual amount you owe). Understanding amortization is crucial because it demystifies your loan. It allows you to see how your money is allocated with each payment, visualize how your debt shrinks over time, and understand the true long-term cost of borrowing. Our Amortization Chart Calculator makes this complex process easy to see and control.
How does the Amortization Chart Calculator help me visualize my loan?
Our Amortization Chart Calculator transforms raw numbers into intuitive visuals, providing powerful insights at a glance. It generates several key charts:
- Payment Breakdown Chart: Shows how your monthly payment shifts over time from being mostly interest to mostly principal.
- Outstanding Balance Chart: Graphically displays your loan balance decreasing, allowing you to compare your standard payoff path against any accelerated strategies.
- Cumulative Paid Chart: Illustrates the running total of all principal and interest paid, helping you grasp the overall cost of your loan.
- Total Cost Pie Chart: A simple but impactful visual that shows the proportion of your total loan repayment that goes to principal versus total interest, often revealing surprising insights into the true cost of borrowing.
These dynamic charts empower you to see your progress and the direct impact of your financial decisions.
What is "Target Payoff Duration," and how does this calculator use it?
“Target Payoff Duration” is a powerful feature unique to this Amortization Chart Calculator that puts you in control of your debt-free date. Instead of just adding extra payments, you define your desired loan term (e.g., “15 years” instead of your original “30 years”). The calculator then automatically determines the exact monthly payment (Principal & Interest) you would need to make to achieve that specific payoff goal. This feature is designed for accelerating your loan payoff to a precise target.
What happens if I set a "Target Payoff Duration" that's longer than or equal to my original loan term?
The “Target Payoff Duration” feature is specifically for accelerating your loan payoff. If you attempt to set a target duration that is longer than or equal to your original loan term, the Amortization Chart Calculator will not perform the calculation. Instead, it will display a clear message indicating, “Target must be less than original loan term.” This prompts you to enter a shorter, accelerated payoff goal to utilize the feature as intended.
How do extra monthly payments or lump sum payments affect my loan's amortization?
Both extra monthly payments and lump sum payments are highly effective ways to accelerate your loan payoff and significantly reduce the total interest you pay. Every additional dollar you contribute directly reduces your loan’s principal balance. Since interest is calculated on your outstanding principal, lowering that balance means less interest accrues over time.
- Extra Monthly Payments: Small, consistent additions can shave years off your loan.
- Lump Sum Payments: One-time larger payments (e.g., from a bonus or tax refund) have an immediate, dramatic impact on your principal. However, if you utilize the “Target Payoff Duration” feature, it overrides these individual strategies, as the calculator focuses on the single payment required to meet your specific date goal. For a deeper analysis of various accelerated payoff strategies, explore our Pay Off Mortgage Faster Calculator.
How accurate are the results provided by this Amortization Chart Calculator?
Our Amortization Chart Calculator uses standard, widely accepted financial formulas to generate highly accurate estimates based on the inputs you provide. It gives you a very reliable projection of your loan’s path and potential savings. While the results are extremely close, minor differences might occur compared to your specific lender’s statements due to their unique rounding rules, payment processing times, or subtle variations in interest compounding. This tool is designed as a powerful and reliable planning aid, not a definitive legal statement of your loan.
Can I save or print my detailed loan amortization schedule and charts?
Absolutely! We’ve made it easy to keep a record of your financial planning. You can download individual charts (like the Payment Breakdown or Outstanding Balance charts) as high-quality image files. For a comprehensive record, simply click the “Print Report” button. This generates a beautifully formatted, PDF-friendly version of all your results, including your input details, summary, all generated charts, and the full payment-by-payment amortization table, which you can then save or print for your records or to share.
Can I use this Amortization Chart Calculator for loans in different currencies or countries?
Yes, absolutely! Our Amortization Chart Calculator includes a multi-currency selector that supports USD ($),EUR(€),GBP(£),CAD($), INR and AUD ($). While specific loan products and terms can vary by region, the core mathematical principles of amortization are universal. This makes our tool incredibly versatile and suitable for planning and visualizing loans from almost anywhere in the world.
Is this calculator suitable for variable interest rate loans (like Adjustable-Rate Mortgages)?
Our current Amortization Chart Calculator is designed to project amortization based on a fixed interest rate for the entire loan term. If you have a variable-rate loan, you can still use it to get a clear snapshot by entering your current interest rate and remaining term. If your interest rate changes in the future, you would simply re-enter the new rate to generate an updated amortization schedule. It’s best utilized for fixed-rate analysis or for dynamic “what-if” scenarios with variable loans.
Glossary of Terms
Understanding the language of loans can help you feel more confident and in control. Here’s a brief glossary of key terms you’ll encounter when using our Amortization Chart Calculator:
- Principal: The original amount of money you borrowed for your loan, or the outstanding balance of that loan. This is the core amount you need to pay back.
- Interest: The cost of borrowing money, expressed as a percentage of the principal. It’s essentially the fee the lender charges you for using their money.
- Amortization: The gradual process of paying off a debt over time through regular, scheduled payments. Each payment covers both principal and interest. The word comes from the Latin “ad-mortem,” meaning “to death,” implying paying off a debt until its “death.”
- P&I (Principal & Interest): This refers to the portion of your monthly loan payment that goes directly towards reducing your principal balance and covering the interest charged. It typically excludes taxes and insurance.
- Loan Term: The total duration, typically expressed in years, over which you’ve agreed to repay your loan. For example, a 30-year mortgage has a loan term of 30 years.
- Lump Sum Payment: An unscheduled, one-time additional payment made directly towards the principal balance of your loan. These are powerful tools for accelerating payoff and saving interest.
- Payoff Date: The exact date when your final loan payment is made, and your debt is completely retired. This is the date you become debt-free!
- Cumulative Interest: The running total of all interest paid on a loan from its beginning up to a specific point in time.
Explore More Financial Tools
Your financial journey is multifaceted, and we’re here to support you with a suite of intuitive tools. After mastering your loan’s amortization, perhaps you’re curious about other aspects of your financial landscape.
Explore these related calculators to continue your informed planning:
How Much House Can I Afford with My Income?: Wondering what kind of home fits your current income and budget? Our House Affordability Calculator helps you estimate your ideal price range based on your earnings, debts, and expenses—guiding you toward confident homeownership.
- Payoff Faster Mortgage Calculator: If your primary focus is on accelerating your mortgage payoff, our dedicated Payoff Faster Mortgage Calculator offers even more specialized insights and strategies tailored specifically for home loans.
We believe that informed decisions lead to financial peace of mind. Continue your exploration and empower your financial future with our free, user-friendly tools.
A Note on Accuracy for Our Amortization Chart Calculator
While this Amortization Chart Calculator provides highly precise estimates, it’s important to understand a few factors that might lead to slight variations compared to your lender’s official statements. Our calculations are based on standard amortization formulas, assuming a fixed interest rate and consistent payment schedule.
However, real-world lender calculations can sometimes differ due to:
- Rounding: Lenders may use different rounding conventions for interest and principal calculations on a per-payment basis.
- Compounding Method: While most loans compound interest monthly, slight variations in how interest is calculated on a daily or periodic basis can occur.
- External Factors: Our calculator focuses purely on principal and interest. It does not account for additional components often included in a full mortgage payment, such as property taxes, homeowner’s insurance (escrow), or mortgage insurance, which can fluctuate.
Therefore, use the results from this Amortization Chart Calculator as a powerful planning tool and an accurate estimate, but always refer to your official lender statements for the exact figures and current loan status.
Important Legal and Financial Disclaimer
Please read this important notice regarding the use of our Amortization Chart Calculator:
This calculator and the information presented on this page are provided for informational and illustrative purposes only. They are designed to help you understand the concept of loan amortization and to estimate potential loan payoff scenarios based on the data you provide.
- Not Financial Advice: The results and insights generated by this tool do not constitute financial, investment, tax, or legal advice. We are not qualified to offer such advice.
- Estimates Only: All calculations are approximate and are based on standard financial formulas and the inputs you enter. Actual loan terms, interest calculations, payment applications by lenders, and real-world financial situations may vary due to various factors (e.g., specific lender policies, payment processing delays, rounding methodologies, changes in market interest rates for variable loans, and unforeseen circumstances).
- No Guarantees: We cannot guarantee the exact accuracy of your actual loan payments or payoff schedule, as these are ultimately determined by your specific loan agreement and lender.
- Consult a Professional: We strongly advise you to consult with a qualified and licensed financial advisor, mortgage professional, tax consultant, or legal expert before making any significant financial decisions or committing to any specific loan repayment strategy. They can provide personalized advice tailored to your unique circumstances and objectives.
- No Liability: By using this calculator, you acknowledge and agree that Lifegic.com and its affiliates are not responsible for any financial outcomes, losses, or decisions you may make based on the information provided by this tool. Your use of this calculator is at your own discretion and risk.
This tool is a powerful educational and planning aid, but it should always be used in conjunction with professional financial guidance.
Learn more about amortization here: https://www.investopedia.com/terms/a/amortization.asp
Final Thoughts
Feeling more in control? That’s our hope. The journey of paying off a loan, especially a significant one like a mortgage or student debt, can feel long and daunting. But with the right tools, it transforms into a clear, manageable path. Our Amortization Chart Calculator is designed to be that guiding light, removing the guesswork and putting the power of financial clarity directly into your hands.
Imagine the feeling of knowing exactly when you’ll be debt-free. Imagine the satisfaction of seeing how every strategic payment you commit translates into real savings and accelerated freedom. This isn’t about complex financial jargon; it’s about making your money work harder for you, visibly and understandably. You’ve explored the features, seen the scenarios, and now you know how impactful this tool can be. There’s nothing standing between you and a clearer financial future. No sign-ups, no hidden costs, no personal data required. Just a simple, powerful tool waiting for you.
Start planning your financial future with our Amortization Chart Calculator — no email, no signup required. Your journey to debt freedom, visualized and empowered, begins now.